News
Abstract
This article describes working with Navigator for i System Monitors for the new Navigator for i
Content
Available on the new IBM Navigator for i 7.3 and later releases. System Monitors on new Navigator, All functions not available immediately, see list of Enhancements for future functions.
Introduction
System Monitors monitors track current information about the performance of your system. You can use them to carry out predefined actions when a specific event occurs. Monitors continue to monitor and perform any commands or actions you specified as a threshold until you stop the monitor.
Sections:
- Overview
- System Monitor Example
- Copy Monitor to another System
- Replacement Variables
- Collection Interval for Monitor Metrics
See also:
- Monitors Overview
- Authority
- Stop Monitor Server
- Implementation Details
- Debug files
- Message Monitors Overview
- System Monitor Best Practices
- System Monitor Replacement Variables
- System Monitor Interval - Manual Reconfiguration
- Send email or text as a monitor action
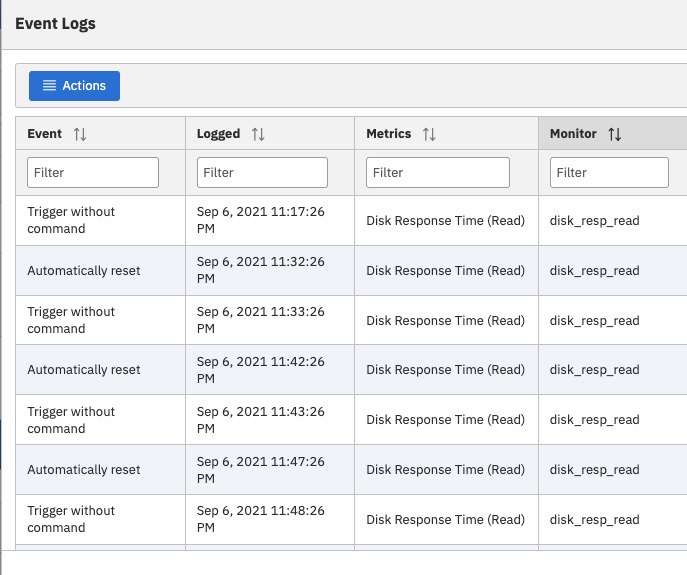
- Event log does not show triggered events...
- System Monitor Troubleshooting
- Deleting a user profile that owns a monitor
For general System Monitor usage steps for Performance Data Investigator, see: System Monitor
Overview
IBM Navigator for i provides the following types of monitors:
- System monitor
| Collect and display performance data as it happens. System monitors use Collection Services data to track the metrics of system performance that you select. Detailed graphs help you visualize what is going on with your system as it happens. Choose from various metrics (performance measurements) to pinpoint specific aspects of system performance. |
|
Find out whether your application completes successfully or monitor for specific messages that are critical to your business needs. You can see the details of a message, reply to a message, send a message, delete a message, and view or change the properties of a message. Under the Monitors folder in the navigator area, users can access the system & message monitor lists. From the system & message lists, users can create, modify, start, or stop a monitor, and also can view event log list and view associated Performance Data Investigator charts for the system monitor metrics. |
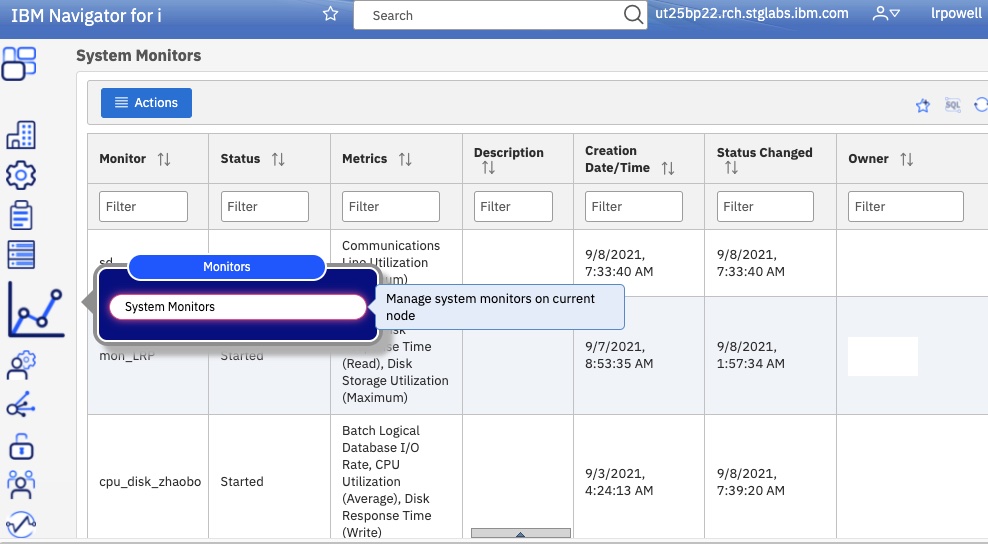
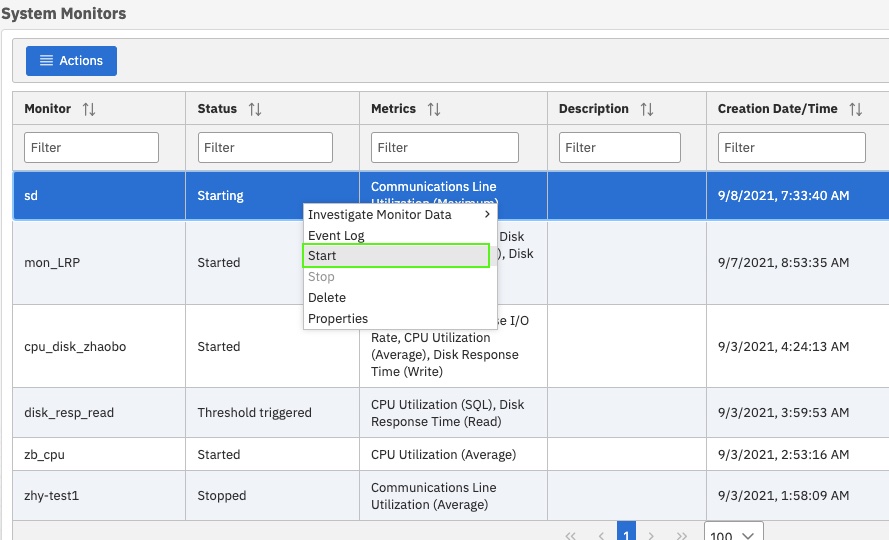
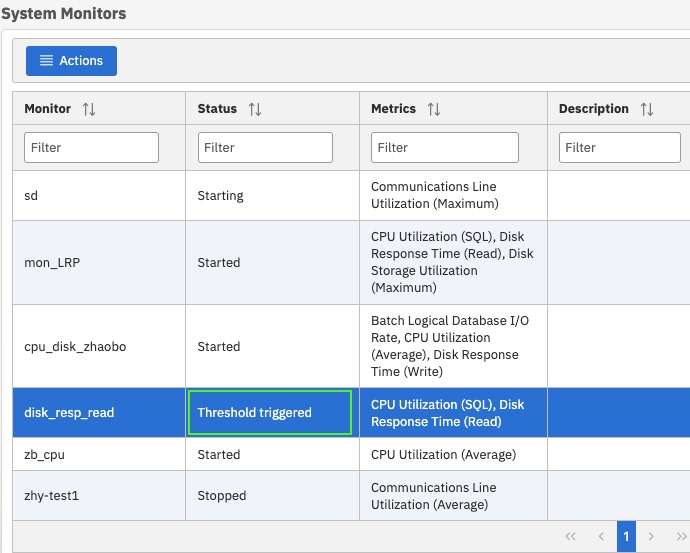
Figure 1: System Monitors
System Monitor Example
Here is an example with system monitors. Use this example to learn how to set up a system monitor in IBM Navigator for i and how to configure it to take the best advantage of the available options.
Situation:
As a system administrator, you need to ensure that the system has enough resources to meet the current demands of your users and business requirements. For your system, CPU utilization is an important concern. To receive alerts if the CPU utilization gets too high or to temporarily hold any lower priority jobs until more resources become available.
To get an alert, you can set up a system monitor that sends you a message if CPU utilization exceeds 80%. Moreover, it can also hold all the jobs in the QBATCH job queue until CPU utilization drops to 60%, at which point the jobs are released, and normal operations resume.
Create the monitor steps:
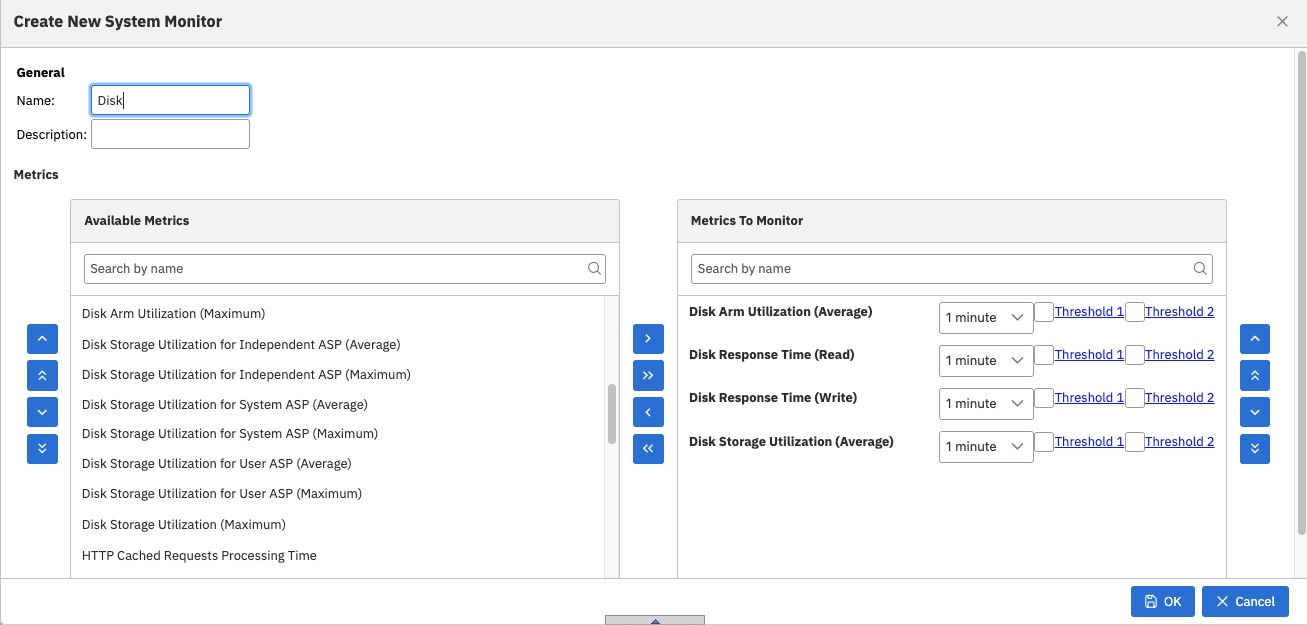
| a. It moves from "Available Metrics" to "Metrics to Monitor". |
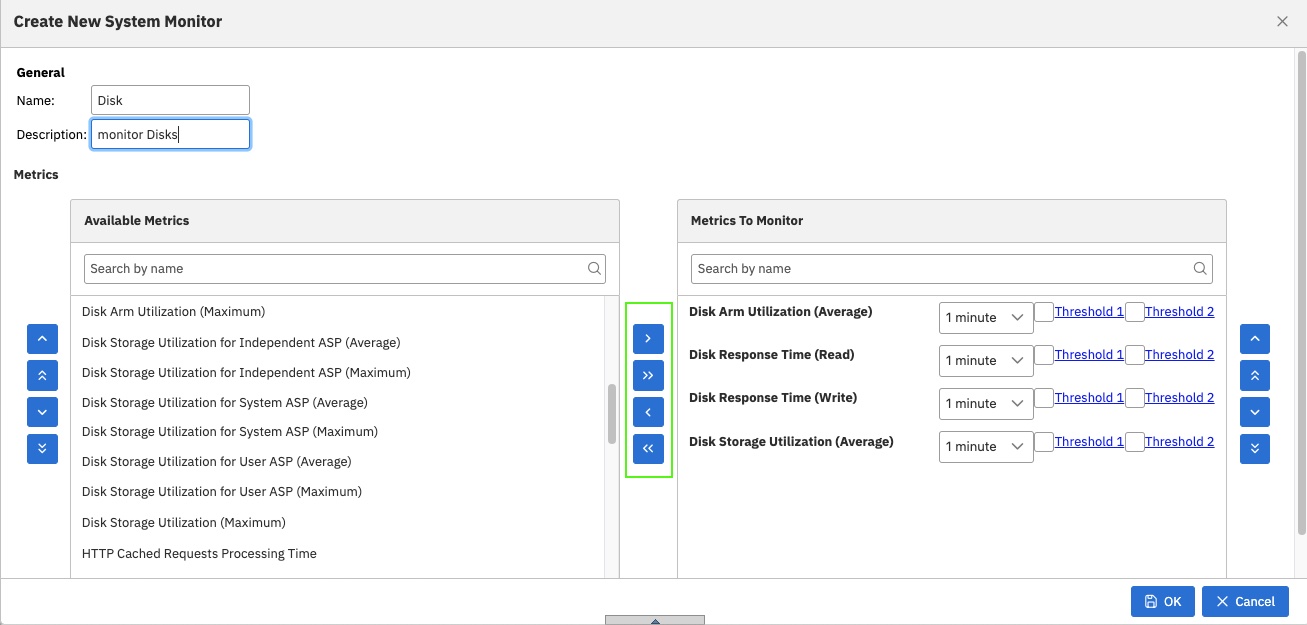
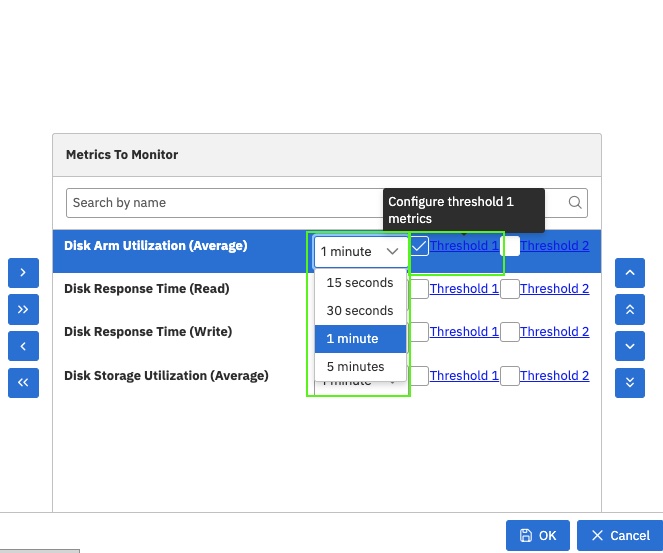
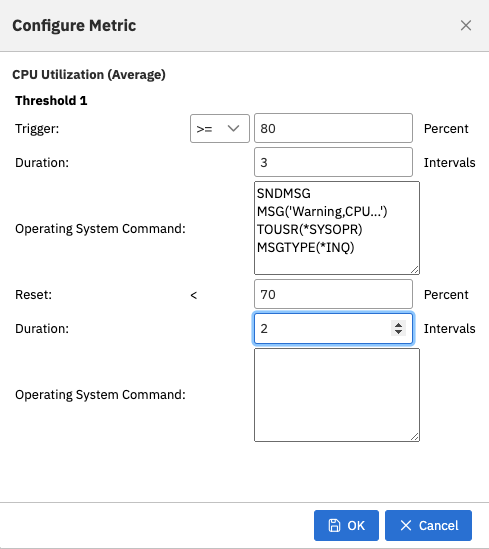 Figure: Set threshold configuration and command
|
|
d. For Threshold 1, enter the Trigger value (Percent).
For Duration, specify the number of intervals to allow the threshold to be exceeded before the trigger is activated (default is one).
For IBM i Command, enter the command to send an inquiry message
|
For the threshold Reset value, specify < 70 (less than 60 percent busy). This action resets the monitor when CPU utilization falls under 70% (note there is also an Interval Duration parameter that defaults to one).
|
To temporarily hold lower priority jobs until more resources become available:
on trigger: HLDJOBQ JOBQ(QBATCH)
|
| on reset: RLSJOBQ JOBQ(QBATCH) This command releases the QBATCH job queue when CPU utilization stays under 60% for five collection intervals. |
Figure 5
4. Click OK to save the threshold property.
5. Click OK to save the monitor metric
The new monitor, collects the CPU utilization and other metrics, with new data points added every 60 seconds, according to the specified collection interval. The monitor automatically carries out the specified threshold actions whenever CPU utilization reaches 80%. The monitor continues to run and to perform threshold actions until the monitor is stopped.
Note: A monitor carries out the threshold action exactly one time when the threshold trigger value is reached until the monitor is reset. If the value continues to exceed the threshold for multiple intervals, the action is not invoked again until after the threshold reset value is reached. After the threshold is "reset", it can later "trigger" when reaching the threshold settings again.
Users can include any number of the available metrics in the same monitor, and each metric can have its own threshold values and actions. Users can also have several system monitors that run at the same time.
Note: Collections services keep collecting data even if you turn off the monitor. When monitors override the settings of Collection Services to gather performance data more frequently, the settings are not undone when a monitor stops. If you no longer want to collect the data as often, you must manually change the Collection Services settings or use the Reset button.
For more information about system monitor and metrics, refer to the link on the IBM Docs: https://www.ibm.com/docs/en/i/7.4?topic=i-navigator-monitors
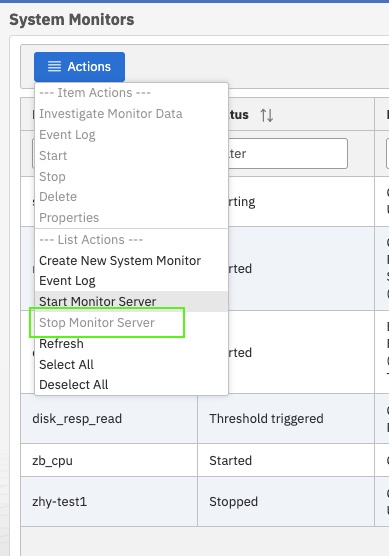
Stop Monitor Server
Use the "Stop Monitor Server" action to end the server before you apply PTFs.
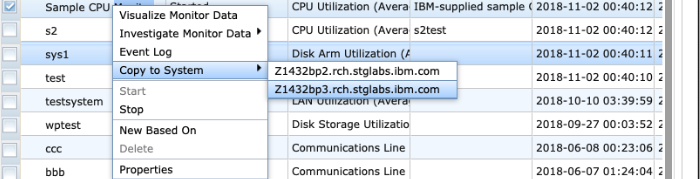
Copy a Monitor to another System
You can use the "Copy to System" function to copy a specific monitor to any system listed in the Target System List.
Select that system on the Copy to System action panel from the Monitors-> System panel.
Replacement Variables
Replacement variables are available for both System & Message monitors.
Use these links for more information:
Collection interval for monitor metrics
Recommended collection interval time for monitor metrics is one min or longer to keep monitor collections from growing larger than necessary. Default is set to one minute starting with the June 2016 SP. Previously created monitors may still have the default of 15 sec if that value was not manually modified.
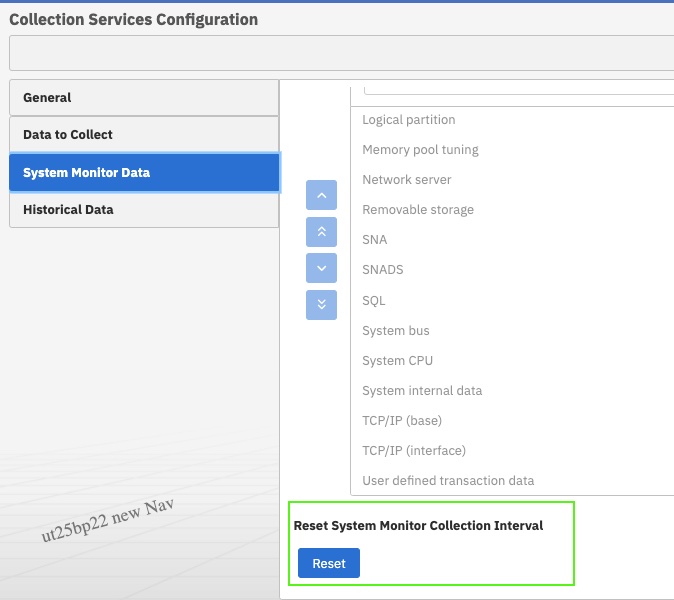
With the 2H 2021 New Navigator monitors, there is an option to Reset the System Monitor Collection Interval. This button performs the steps listed in the manually modified page for you:
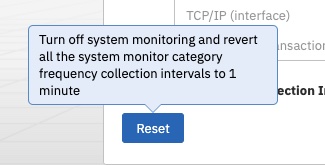
- Turn off System Monitoring
- Revert all the system monitor categories to collection frequency of 1 minute
- Asks if you want to Cycle the Collector to cause these new settings to take effect immediately
Was this topic helpful?
Document Information
Modified date:
08 March 2022
UID
ibm11146586